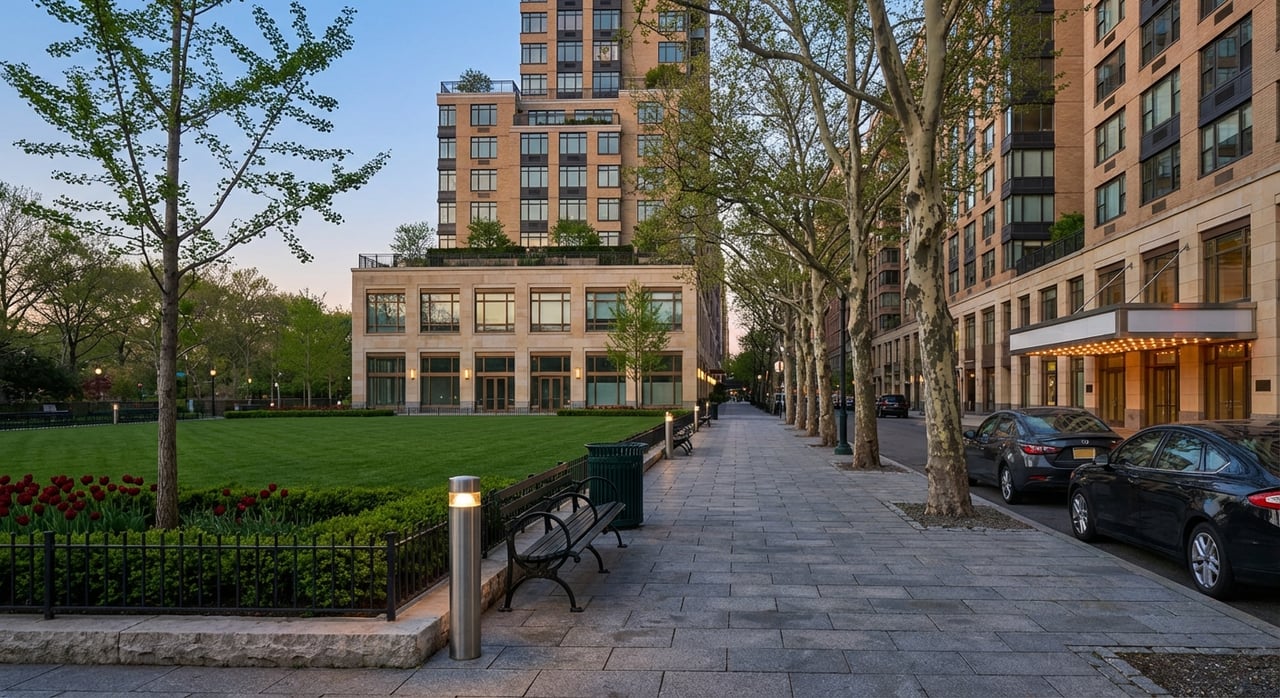
Ask what a resale premium looks like on Billionaires' Row and most people will give you one number. The real answer splits in two directions within the same corridor. At 220 Central Park South, resale units have traded at a 28.3 percent premium over their previous sale price. At 520 Park Avenue, part of the same corridor and built to the same trophy-condo standard, resales have settled 25.8 percent below their previous sale price. Same name, same tier of construction, opposite outcomes for the seller.
That gap is the story. Buyers and sellers who treat "Billionaires' Row" as a single market are pricing risk using the wrong building's history, and the aggregate statistics everyone quotes make that mistake easy to make.
One Name, Seven Sales Histories
The corridor itself is a media label, not a zoning designation. It refers to a cluster of supertall condominium towers along West 57th Street and the southern edge of Central Park, built by different developers over roughly a decade, each selling into a different phase of the market cycle.
As of late 2025, roughly 44 percent of the corridor's approximately 772 condominiums remained unsold, representing more than $6.7 billion in inventory still on the sponsor's books. That figure gets repeated as if it describes the corridor evenly. It doesn't. Some of these towers are effectively sold out. Others have been selling for six years and still have more than a hundred units to move.
The Same Address, Wildly Different Outcomes
| Tower | Launch-Era Discount vs. Original Ask | Resale Track Record | Current Standing |
|---|---|---|---|
| 432 Park Avenue | 9.1% off offering | 0.4% off prior sale, frequently at a premium | Nearly sold out, one sponsor unit remaining |
| 220 Central Park South | 1.8% off offering | 28.3% premium over prior sale | Highest grossing tower on the corridor, roughly $3.2 billion sold |
| Central Park Tower | Deep discounting at the top of the market | Full-floor units clearing the high $6,000s per square foot in late 2025; penthouse PH107 closed roughly 33% below its original ask in June 2024 | More than 100 units still unsold |
| One57 | 0.2% off offering | Discounted on resale, in line with 520 Park's pattern | Long-established comparable |
| 520 Park Avenue | 13.8% off offering | 25.8% below prior sale on average | 20% of units still unsold |
| 111 West 57th Street (Steinway Tower) | Historically cited as steep discounts | 23 units unsold in July 2024, down to 10 by April 2025 | Near sellout following a sales team change |
| 53 West 53rd Street (MoMA Tower) | Entry point around $3 million | Slowest-moving building on the corridor | 66% unsold after six years on the market |
Read across that table and the "Billionaires' Row premium" stops meaning anything specific. It is an average of buildings moving in opposite directions.
What Actually Drives The Split
The variance is not random. Four factors explain most of it, and each one is knowable before a buyer signs a contract.
- Unit mix. 53 West 53rd Street carries a heavier concentration of one-bedroom units than any other tower on the corridor, which pulls its average sale price down to $6.288 million even though the building sits on Billionaires' Row. A buyer comparing that number to 220 Central Park South's $37.396 million average is comparing two different products, not two prices for the same thing.
- Sponsor overhang timing. A building still carrying more than a hundred unsold units, as both 53 West 53rd and Central Park Tower do, gives buyers negotiating leverage the sponsor cannot avoid. A building down to its last unit, like 432 Park, does not.
- Sales team continuity. 111 West 57th Street's turnaround traces to a specific change: Nikki Field of Sotheby's International Realty took over as the building's condominium sales agent in July 2024, when 23 units remained unsold. Her team closed 22 of them for a combined $480 million, and the building was down to 10 unsold apartments by April 2025.
- Amenity and view permanence. Central Park Tower's Central Park Club spans roughly 50,000 square feet across multiple floors, a program that exceeds anything else on the corridor. That scale supports pricing power on some units even as the building works through a large remaining sponsor pool.
None of these four factors show up in a headline "average price per square foot" for the corridor. All four show up the moment you ask about a specific building.
The Persistent Myth Of The "75 Percent Unsold" Tower
Here is where the stale-data problem gets concrete. An older, still widely circulated figure put 111 West 57th Street at 75 percent unsold, with closed sales discounted an average of 15.4 percent off list. That number gets forwarded in market summaries and buyer conversations as if it still describes the building today.
It doesn't. By July 2024, the building had 23 units left. By April 2025, it had 10, according to the building's documented sales history. A tower once cited as three-quarters empty was, within roughly nine months, closer to sold out than not. Anyone using the older figure to negotiate against sponsor inventory, or to argue the building lacked demand, was working from a picture that had already changed.
This is the general risk with corridor-wide data. It ages. A building's sales pace can shift entirely within a year, and the old headline number keeps circulating long after the underlying inventory has moved.
Reading A Tower Before You Buy Or Sell
The corridor's aggregate statistics are a starting point, not a conclusion. Before treating any Billionaires' Row listing as investment grade, a few questions do more work than the average price per square foot ever will.
- Ask for the building's current unsold unit count directly, not a figure from an article that may be a year or more old.
- Ask how the building's resale transactions have actually performed, not how the corridor performed. A 432 Park comp tells you nothing about a 520 Park listing.
- Ask whether the sales team or sponsor structure has changed recently. A new agent taking over unsold inventory, as happened at 111 West 57th, often signals a repricing effort already underway.
- Compare the specific building's days on market and discount rate against the broader luxury segment, which averaged roughly 105 days on market and a 6.4 percent listing discount as of spring 2026, itself slower than the broader Manhattan resale market's 71 days and 5.2 percent discount at the same point. A building running well outside those figures, in either direction, is telling you something the address alone won't.
For sellers, the lesson cuts the other way. A unit in a building with 220 Central Park South's resale history can support confident, well-researched pricing. A unit in a building with 520 Park's or One57's pattern needs a strategy built around that building's actual comps, not the corridor's reputation.
The Broader Market Context
The corridor is not standing still while this sorts out. Manhattan condo contract signings rose 7.7 percent year over year in the $4 million to $4.99 million range and 45.8 percent in the $5 million to $9.99 million range in January 2026, even as new listings in those bands fell 26.1 percent and 23 percent respectively. In the week ending March 8, 2026, Manhattan logged 43 signed contracts at $4 million and above, the strongest week since May 2025, and only nine of those involved new development. Resale inventory, not sponsor units, is carrying current demand at the top of the market. That makes building-specific resale history more relevant to a 2026 buyer than it has been in years, not less.
FAQ
Does a Billionaires' Row address guarantee resale liquidity? No. The corridor includes towers that have appreciated on resale and towers that have discounted by roughly a quarter of their previous sale price. The address does not determine which category a given unit falls into.
How should I treat published corridor-wide price and inventory averages? As a starting reference only. Ask for the specific building's current unsold count and resale comps before relying on any corridor-wide figure, since those numbers can be a year or more out of date by the time they're widely quoted.
Comparing towers on Billionaires' Row means comparing sales histories that have little in common beyond a shared zip code. If you're weighing a purchase or a sale in this corridor and want the building-specific analysis rather than the corridor average, Hilary James can walk through what a specific tower's resale pattern actually means for your position. Request a confidential consultation to start that conversation.